
Raman Spectra of Fluid Inclusions
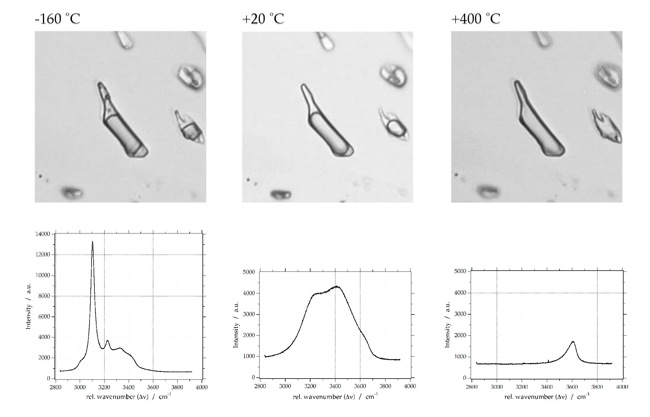
Pure H2O
Raman Spectra of Salt-Hydrates at low temperatures (frozen fluid inclusions)

Raman Spectra of Gases

Deconvolution of H2O Raman spectrum
Multiple Gaussian-Lorentzian functions can be used to deconvolve the H2O spectrum. The literature offers many possibilities for fitting this stretching region: five deconvolved Gaussian components are defined by e.g. Carey and Korenowski (1998), Furic et al. (2000), Li et al. (2004), and Chumaevskii et al. (2001); four components are defined by e.g. Rull (2002); and three components are defined by e.g. Gopalakrishnan et al. (2005). Bakker (2004) recommends a purely geometrical fit of the Raman water spectrum with three Gaussian-Lorentzian contributions with signal positions at 3222 cm-1 (peak 1), 3433 cm-1 (peak 2) and 3617 cm-1 (peak 3). This approach is an unambiguous procedure for fitting spectra and allows a relative easy comparison of peak positions and changes in spectrum morphology among aqueous solutions of different salinities.


ref.: Baumgartner and Bakker (2009) Mineralogy & Petrology, vol. 95, 1-15.
Salinity of free aqueous saline solution:

sal is the salinity in mass% NaCl
a is 3222.8 (error 0.3) cm-1
b is 1.69 (error 0.02) cm-1
band position of peak 1 in relative wavenumbers
Polarization effects in quartz
ref.: Baumgartner and Bakker (2009) Mineralogy & Petrology, vol. 95, 1-15.
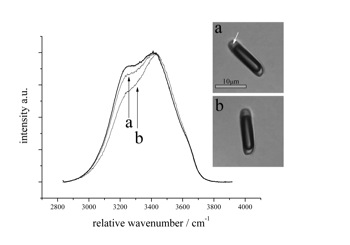
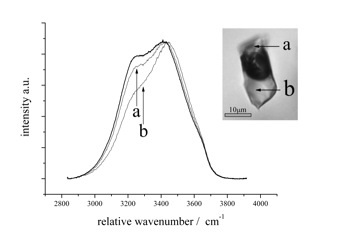
The influence of birefringence
The influence of orientation of quartz-fluid interfaces (polarisation due to reflection)
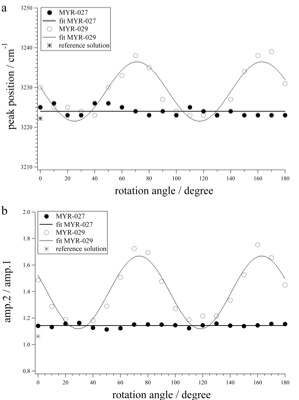
Deconvolved values of Peak1 (a) and amplitude ratios of Peak2/Peak1 (b), measured in synthetic fluid inclusions as a function of rotation in experiments where the sample surface is orientated perpendicular (MYR-027) and parallel to the c-axis (MYR-029). The continuous solid line represents a linear best fit through the data points of sample MYR-027, whereas the data points of sample MYR-029 are best represented by a sinusoidal fit (dotted line). For reference, the peak position and amplitude ratio of pure water (reference solution) are shown.
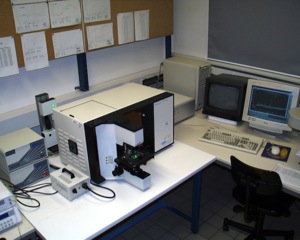
LabRAM 300 (1998)
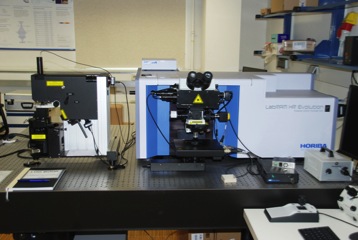
LabRAM HR Evolution (2018)
Raman spectroscopic gas densimeters
ref.: Bakker (2021) Journal of Raman Spectroscopy, doi: 10.1002/jrs.6245

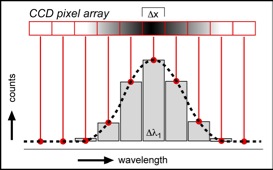
Schematic image of the detection of a Raman band in a discontinuous spectrum. The shading in the CCD pixel array illustrates the intensity of specific wavelengths, each pixel has a size of d(x) (e.g. 16 to 25 µm) and detects a wavelength range of d(lambda1) the vertical bars are the recorded intensities per pixel, and the dashed curve is a best-fit shape reproduction of these intensities.
General properties of the apparatus
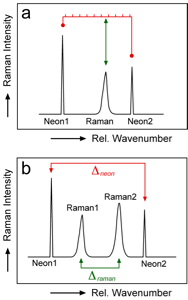
Schematic representation of calibration methods; a. proper bracketing technique of a Raman band between two neon lines; b. line segment technique
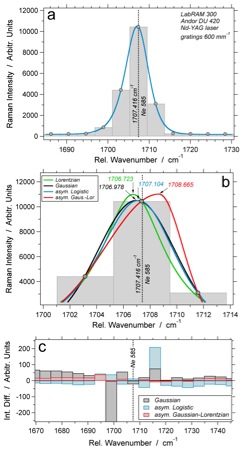
(a) Spectrum of the 585 neon line analysed with the LabRAM 300 system (600 mm-1 gratings), pixel resolution is illustrated by the width of vertical bars, the filled circles are the centre position of individual pixels. The blue curve is a least squared best-fit asymmetric logistic distribution function. (b) various PDF’s that are fitted to the spectrum illustrated in (a). (c) the difference in intensity between distribution functions and individual pixels of the same spectrum.
Modified Scanning Multichannel Technique
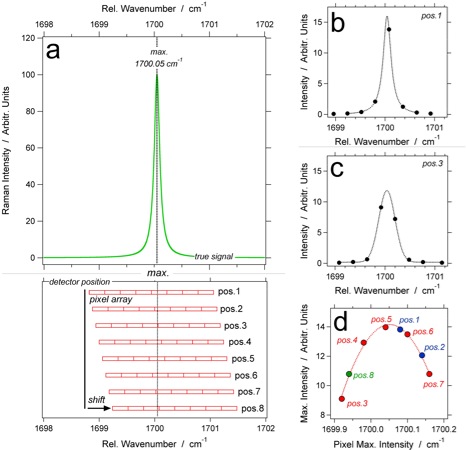
(a) Hypothetical signal of a Raman band or atomic emission line at 1700.05 cm-1, with a schematic illustration of the position of a pixel array of the detector; the detected intensity of each pixel in position 1 (b) and position 3 (c) reveal significant different shape properties; (d) accumulated spectrum of the same band plotting only the pixel with the maximum intensity in each position.
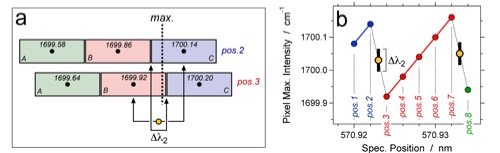
(a) Detail of Figure 9a illustrating the shift of three pixels (A, B, and C) and the position of the maximum intensity of the Raman signal. The transition from position 2 to 3 is used to calculate the peak position of the Raman band (yellow filled circle), and the overlap of both pixels defines the uncertainty d(lambda2). (b) accumulated data of the position of pixels with maximum intensity versus the position of the spectrometer (shift numbers). The black bar illustrates the uncertainty d(lambda2).
Case study 1: wandering neon emission lines
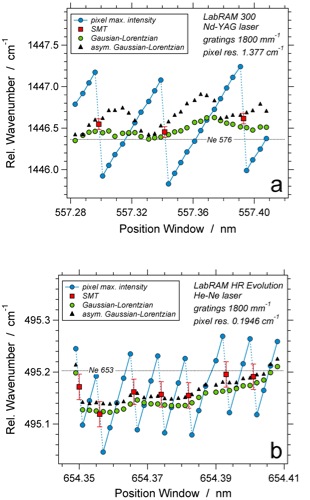
Relative wavenumber of the peak position of the 576 neon line (a), and the 653 neon line (b) as a function spectral window position analysed with the different Raman systems as illustrated in the image.
Case study 2: methane
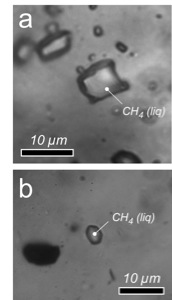
Photomicrographs of two natural CH4 fluid inclusions in quartz with a density of 0.3461 ± 0.0002 g·cm-3 (a) and 0.4011 ± 0.0001 g·cm-3 (b).
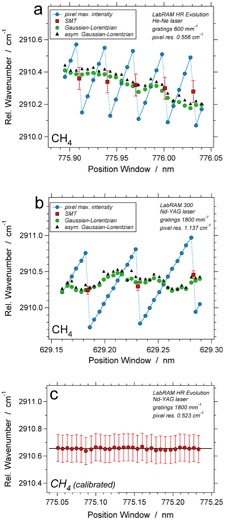
(a) Relative wavenumber of the peak position of CH4 as a function of spectral window position, estimated with SMT and symmetric and asymmetric Gaussian-Lorentzian curves using the LabRAM HR Evolution system with He-Ne laser; (b) similar image using the LabRAM 300 system with a Nd-YAG laser. (c) Calibrated relative wavenumber of peak positions of CH4 as a function of spectral window position, using the proper bracketing method with three adjacent neon lines. All peak positions are obtained with best-fit Gaussian-Lorentzian curves. The error bars illustrate the uncertainty estimated with SMT.
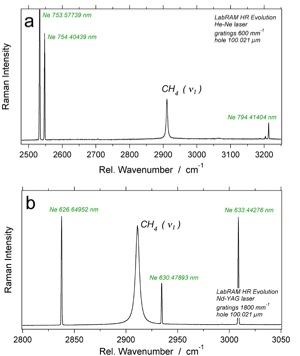
Raman spectra of CH4 with simultaneously recorded neon lines with the LabRAM HR Evolution system, using a He-Ne laser (a) and a Nd-YAG laser (b)
Case study 3: carbon dioxide
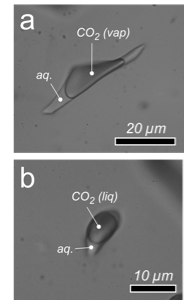
Photomicrographs of two synthetic CO2-rich fluid inclusions in quartz with a density of 0.1477 ± 0.0006 g·cm-3 (a) and 0.8880 ± 0.0007 g·cm-3 (b). The walls of the inclusions are wetted with an aqueous solution (aq).

Raman spectra of CO2 with simultaneously recorded neon lines analysed with the LabRAM 300 system, Nd-YAG laser (a) and the LabRAM HR Evolution system, He-Ne laser (b).
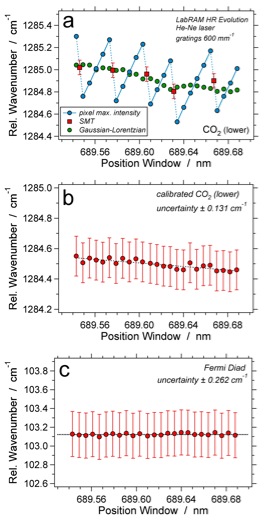
(a) Relative wavenumber of peak position of the lower band of CO2 of the 0.1477 g·cm3 fluid inclusion as a function of spectral window position, estimated with SMT and symmetric Gaussian-Lorentzian curves using the LabRAM HR Evolution system with He-Ne laser; (b) calibrated relative wavenumbers of the lower band of CO2, error bars illustrate the SMT uncertainty; (c) calibrated wavenumber distance of the Fermi diad.


end of page
Cryo-Raman Spectroscopy
detection of phase changes in fluid inclusions, exact determination of eutectic temperatures
ref.: Bakker (2004) The Canadian Mineralogist, vol. 42, 1283-1314.

ref.: Gasparrini et al. (2006) Journal of Sedimentary Research, vol. 76, 1304-1322.
ref.: Baumgartner and Bakker (2009) Chemical Geology, vol. 265, 335-344.
ref.: Baumgartner and Bakker (2010) Chemical Geology, vol. 275, 58-66.

ref.: Lapponi et al. (2007) Terra Nova, vol. 19, 440-444.
ref.: Schneider et al. (2008) Journal of Sedimentary Research, vol. 78, 282-300.


Examples Salt-Hydrate Spectra (and ice)
ice
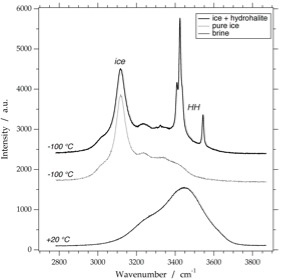
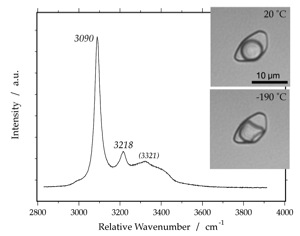
Raman spectrum of ice at -190 Celsius. The measured fluid inclusion contains vapour and water at 20 Celsius (with a critical density), and vapour and ice at -190 Celsius
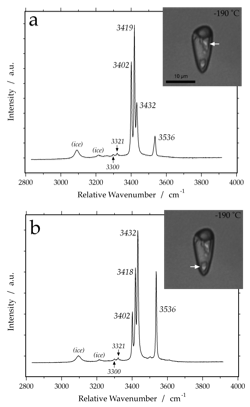
hydrohalite
Raman spectrum of hydrohalite at -190 Celsius, obtained from two single hydrate crystals with different orientations, as illustrated in the synthetic fluid inclusion (arrows).
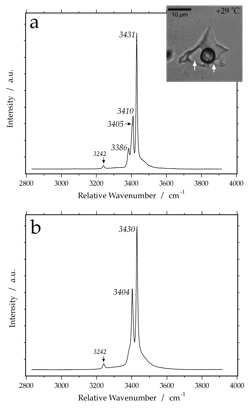
antarcticite (CaCl2-6H2O)
Raman spectrum of antarcticite at -190 Celsius. Variable peak intensities (a and b) are caused by different crystallographic orientations of the measured hydrate crystals. The measured fluid inclusion contains at room temperature a metastable phase assemblage of vapour and brine. After cooling and hydrate nucleation, a stable phase assemblage was obtained with brine, vapour and antarcticite, which melts at about +30 Celsius.
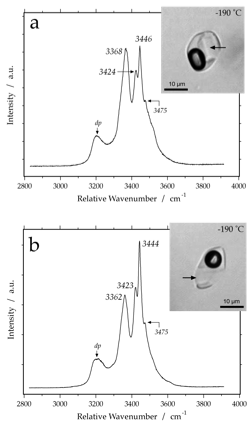
alpha-CaCl2-4H2O
Raman spectrum of alpha-CaCl2-4H2O at -190 Celsius. Variable peak intensities (a and b) are caused by different crystallographic orientations of the measured hydrate crystals. dp indicates a double peak, that consist of at least two Gaussian-Lorentzian components. The images of the inclusions illustrate metastable phase assemblages at -190 Celsius (vapour + brine + hydrate) and the position of measurement (arrows).
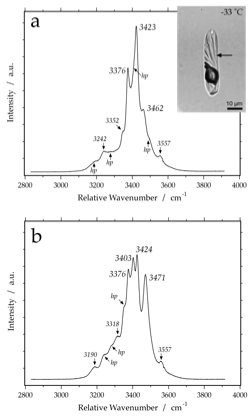
Raman spectrum of sinjarite at -190 Celsius. Variable peak intensities (a and b) are caused by different crystallographic orientations of the measured hydrate crystals. hp are hidden peaks that may develop into real peaks in specific orientations, or remain present as shoulders.
sinjarite (CaCl2-2H2O)

MgCl2-12H2O
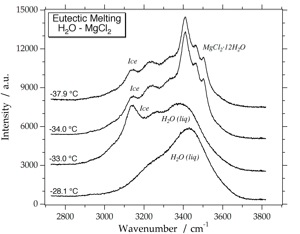
Raman spectrum of MgCl2-12H2O at -190 Celsius. Variable peak intensities (a and b) are caused by different crystallographic orientations of the measured hydrate crystals. The illustrated fluid inclusions contain a stable phase assemblage (fi1: ice + hydrate + vapour) and a metastable phase assemblage (fi2: ice + brine + vapour) at -34 Celsius.
FeCl2-6H2O

Raman spectrum of FeCl2-6H2O at -190 Celsius. Variable peak intensities (a and b) are caused by different crystallographic orientations of the measured hydrate crystals.

LiCl-Hydrate