

Raman Spectra of Fluid Inclusions
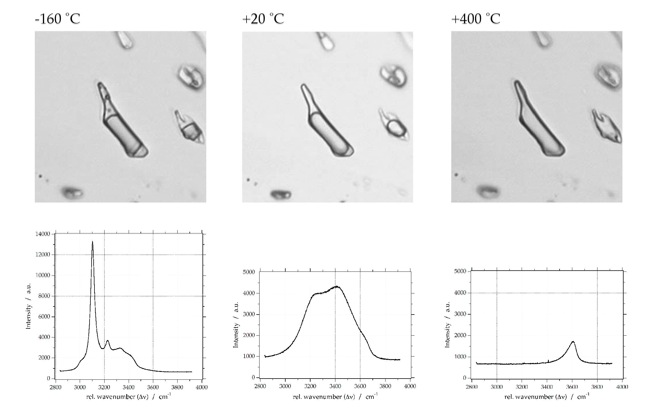
Pure H2O
Raman Spectra of Minerals
A highly accurate and precise Raman spectra dataset on minerals and industrial materials is being developed. Spectra will be compared with a unique search method.

Raman Spectra of Gases

Deconvolution of H2O Raman spectrum
Multiple Gaussian-Lorentzian functions can be used to deconvolve the H2O spectrum. The literature offers many possibilities for fitting this stretching region: five deconvolved Gaussian components are defined by e.g. Carey and Korenowski (1998), Furic et al. (2000), Li et al. (2004), and Chumaevskii et al. (2001); four components are defined by e.g. Rull (2002); and three components are defined by e.g. Gopalakrishnan et al. (2005). Bakker (2004) recommends a purely geometrical fit of the Raman water spectrum with three Gaussian-Lorentzian contributions with signal positions at 3222 cm-1 (peak 1), 3433 cm-1 (peak 2) and 3617 cm-1 (peak 3). This approach is an unambiguous procedure for fitting spectra and allows a relative easy comparison of peak positions and changes in spectrum morphology among aqueous solutions of different salinities.


ref.: Baumgartner and Bakker (2009) Mineralogy & Petrology, vol. 95, 1-15.
Salinity of free aqueous saline solution:

sal is the salinity in mass% NaCl
a is 3222.8 (error 0.3) cm-1
b is 1.69 (error 0.02) cm-1
band position of peak 1 in relative wavenumbers
Polarization effects in quartz
ref.: Baumgartner and Bakker (2009) Mineralogy & Petrology, vol. 95, 1-15.
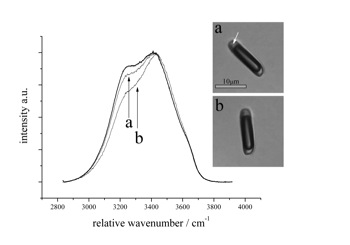
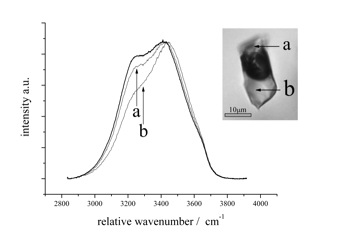
The influence of birefringence
The influence of orientation of quartz-fluid interfaces (polarisation due to reflection)
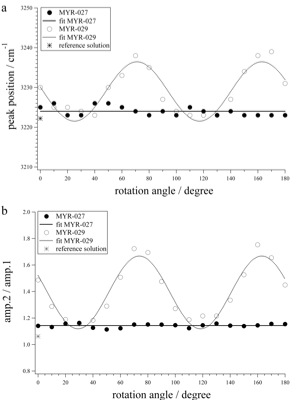
Deconvolved values of Peak1 (a) and amplitude ratios of Peak2/Peak1 (b), measured in synthetic fluid inclusions as a function of rotation in experiments where the sample surface is orientated perpendicular (MYR-027) and parallel to the c-axis (MYR-029). The continuous solid line represents a linear best fit through the data points of sample MYR-027, whereas the data points of sample MYR-029 are best represented by a sinusoidal fit (dotted line). For reference, the peak position and amplitude ratio of pure water (reference solution) are shown.